We use cookies to improve your experience on our website. By continuing you acknowledge cookies are being used.
| 3-month return (%) | 1 year (% p.a.) | 10 year (% p.a.) |
|---|---|---|---|
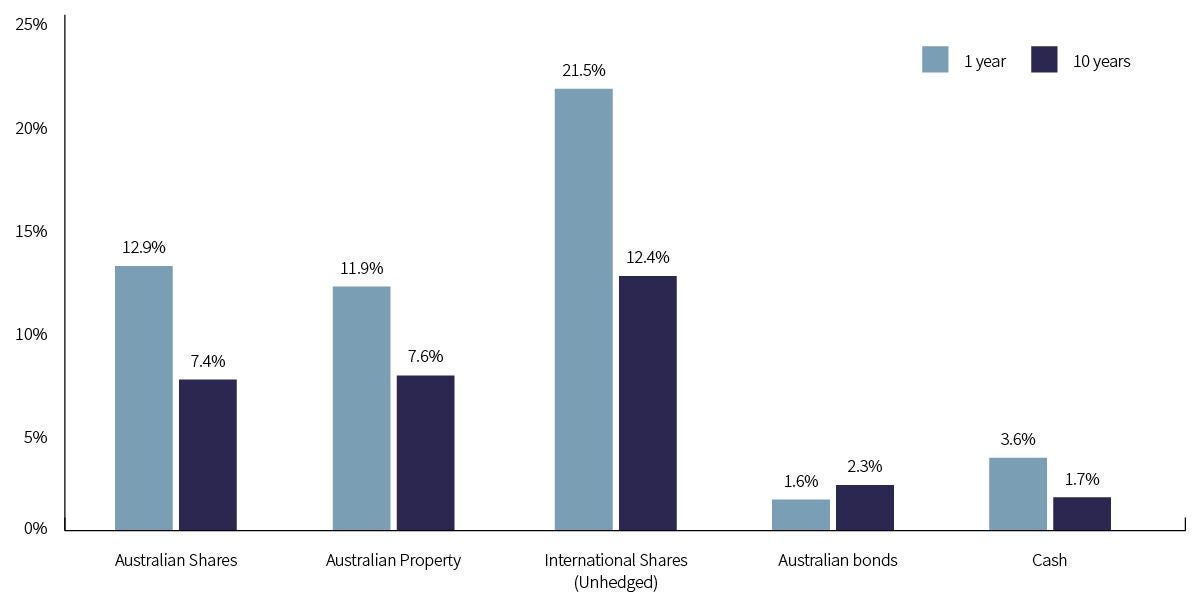
| Australian shares | -0.8 | 12.9 | 7.4 |
S&P/ASX 300 Accumulation Index
The Australian market struggled somewhat over the quarter, with the broad market index, the S&P/ASX 300 Accumulation Index losing 0.8%. The best performing sectors were Energy and Consumer Discretionary, which were up around 8% and 4% respectively. Healthcare was the worst performing sector for the quarter, losing approximately 9%.
As expected during a negative quarter, large caps outperformed the smaller-sized securities in the market. From a market capitalisation perspective, micro caps were the worst performers losing approximately 5% for the quarter. Small caps produced a negative return of around 2%, while midcaps lost 1.7%.
At a style level, Value and Value-Weighted were the best performing styles for the quarter. The worst performing styles for the quarter were Equal Weight and Growth, down 2.0% and 1.9% respectively.
| 3-month return (%) | 1 year (% p.a.) | 10 year (% p.a.) |
|---|---|---|---|
| Australian shares | -0.8 | 12.9 | 7.4 |
S&P/ASX 300 Accumulation Index
The S&P/ASX 300 A-REIT Accumulation Index moved lower in the September quarter, losing 3.0%. This negative performance was no surprise given the 10-Year Australian Government Bond yield increased significantly over the quarter, finishing the quarter at 4.48%. Note the sector is very concentrated with only 33 securities in the Index as of 30 September 2023 and the top 10 securities make up around 80% of this Index.
Stocks with exposure to Office performed particularly poorly over the quarter, with Cromwell Property Group (CMW) losing around 29%. Dexus (DXS) also lost ground, down approximately 6%, while Charter Hall Group (CHC), a diversified property manager, but has a material exposure to Office lost just over 11%.
In other property sub-sectors, Scentre Group lost around 7.2% for the quarter, while Goodman Group, being the largest security in the Property sector, basically propped up the sector returning a positive return of 6.9%.
| 3-month return (%) | 1 year (% p.a.) | 10 year (% p.a.) |
|---|---|---|---|
| Listed property trusts | -3 | 11.9 | 7.6 |
S&P/ASX 300 A-REIT Index
International markets lost ground over the quarter. On a currency unhedged basis international shares lost 0.4%. This quarter, the AUD again helped unhedged Australia investors, as the AUD depreciated against the U.S. dollar.
From a style perspective, all styles were negative for the quarter. Growth and Small Caps were the worst performing styles for the quarter. The best performing styles i.e. the least negative were Value-Weighted and Value.
In the U.S., Energy stocks were relatively resilient over the quarter, and one of few bright spots in a quarter where few sectors avoided falls.
In Europe, some of the steepest declines came in the Consumer Discretionary sector given concerns over the knock-on effects of higher interest rates on consumers’ disposable income. The Energy sector was a notable exception to the declines, notching up gains amid higher oil prices, as some oil exporting countries cut production.
| 3-month return (%) | 1 year (% p.a.) | 10 year (% p.a.) |
|---|---|---|---|
| International shares | -0.4 | 21.5 | 12.4 |
MSCI World Index – Net Total Return (AUD)
July and August were good months for Australian bonds, but September’s poor performance more than wiped out the previous two month’s positive returns. The main Australian Fixed Interest index, the Bloomberg AusBond Composite 0+ Years Index fell by 0.3% for the quarter.
Australian yields rose over the quarter, with the short end (3-year) of the curve rising by a relatively small 0.04%. At the long end of the curve, the 10-year yield rose by a very significant 0.47%.
The yield to maturity at the quarter’s end was 4.55% for Australian Bonds, with the index having around 5 years duration. This makes most mainstream Australian Fixed Interest funds significantly more attractive than they were at the start of 2022, when the yield to maturity of the Index was around 1.7% with approximately 5.7 years duration.
| 3-month return (%) | 1 year (% p.a.) | 10 year (% p.a.) |
|---|---|---|---|
| Fixed interest | -0.3 | 1.6 | 2.3 |
Bloomberg AusBond Composite Index
The Cash benchmark, the Bloomberg AusBond Bank Bill Index, was up 1.1% for the September quarter. During the quarter, the RBA kept the official cash rate on hold at 4.10%. This was the first quarter without a cash rate increase since Q1 2022. This is the highest official cash rate since Q2 2012..
| 3-month return (%) | 1 year (% p.a.) | 10 year (% p.a.) |
|---|---|---|---|
| Cash | 1.1 | 3.6 | 1.7 |
Bloomberg AusBond Bank Bill Index
The chart below compares 1 and 10 year returns for the major asset classes, as at September 2023.

