We use cookies to improve your experience on our website. By continuing you acknowledge cookies are being used.
Investment market review - Quarter ended 31 March 2026
- Title
- Investment market review - Quarter ended 31 March 2026
The Research Team provides a performance summary and commentary on each of the five main asset classes.
Australian shares
The Australian equity market declined by -2.0% during the first quarter of 2026. While the market reached an all-time high in February, it suffered a sharp -7.3% sell off in as a major geopolitical conflict and energy shock combined with a pivot by the Reserve Bank of Australia (RBA) to a more restrictive stance to dominate sentiment.
Australian Equities outperformed global markets over the quarter supported by Energy and Materials as these sectors benefited from soaring commodity prices, including oil (+63% in March) and uranium (+25% in January). This was in stark contrast to the Australian Information Technology sector, which fell -27.2% over the quarter. The Australian Technology sector is relatively small, especially relative to the US, and while this has provided a headwind during much of the AI strength of the last few years, it helped reduce the declines of the Australian equity market in March and over the quarter.
The Australian defensive sectors, Consumer Staples (+8.4%) during Q1), Telecom Services (+7.7%) and Utilities (+10.3%) were also standout sectors in the domestic market over the quarter as earnings stability become the key focus of investors
Gold Miners, the previous darling sector of the Australian equity market fell sharply in March as the miners felt the double impact of profit taking in the gold price and a surge in the oil price, a key cost of extracting the mineral out of the mines.
Domestic small cap companies declined more than their larger counterparts as they felt the impact of the change in risk sentiment, feeling the brunt of the reversal of the RBA’s monetary policy and the risk off sentiment created by the Iran war.
| 3-month return (%) | 1 year (% p.a.) | 10 year (% p.a.) |
|---|---|---|---|
| Australian shares | -2.0 | 11.6 | 9.4 |
S&P/ASX 300 Accumulation Index
Australian listed property trusts
The Australian Listed Property Trust market faced a significant downturn in the first quarter of 2026, falling -16.4%. This correction was primarily driven by the pivot from the RBA and two interest rate increases, undoing most of the recent easing experience of 2025. The War in Iran further compounded the problems of sticky stubborn inflation pressures as it reinforced the expectation that higher interest rates are likely to persist for longer than previously expected.
As interest rates and bond yields rose the "risk-free rate" increased which technically reduced the net tangible asset (NTA) values of property portfolios.
While large retail mall operators like Scentre Group (-19.1% over the quarter) faced pressure from rising rates, prime shopping centres showed some resilience due to relatively stronger retail sales and rental income that tracks inflation more closely (eg: Vicinity Centres -6.3%).
Global REITs were also impacted the War in Iran and declined in the month of March. However, as inflation is less challenging in other developed economies relative to Australia, Global REITs outperformed domestic REITs over the quarter with the hedged index delivering a positive return of 2.2%.
| 3-month return (%) | 1 year (% p.a.) | 10 year (% p.a.) |
|---|---|---|---|
| Australian listed property trusts | -16.4 | -1.9 | 5.6 |
S&P/ASX 300 A-REIT Index
International shares
Global equity markets experienced a volatile start to 2026, recording a quarterly decline of -6.1%. This negative performance was primarily driven by a significant geopolitical shock in the Middle East that disrupted energy markets and triggered a hawkish shift in global monetary policy expectations.
The escalation of conflict between the US and Israel with Iran in early 2026 led to the effective closure of the Strait of Hormuz, a critical transit point for over 80% of Asia-bound oil and gas. Brent crude prices jumped 63% in March alone, the largest monthly increase in 40 years, reigniting global inflation concerns and the expected inflation spike caused a rapid repricing of interest rate expectations. This pressured equity valuations, especially in growth sectors.
Even before the Iran conflict, US software companies had been sold down aggressively (the sector down approximately -30%) as investors questioned long term viability of Software as a Service (SaaS) as expectations grew that AI technology would potentially eat into a large portion of the SaaS earnings.
The quarter saw a strong rotation from Growth investment style to Value, with Value outperforming the market and growth. Value outperformed Growth by 9.3% over the quarter as the energy shock and rising bond yields favoured defensive and commodity linked sectors.
The Australian dollar (AUD) declined against the major currencies in March, especially the US dollar, as investor sought the relative safety in US cash. The AUD still managed to strengthen relative to all currencies over the quarter, supported by rising domestic bond yields and strong commodity prices in January and February.
| 3-month return (%) | 1 year (% p.a.) | 10 year (% p.a.) |
|---|---|---|---|
International shares | -6.1 | 8.2 | 13.1 |
MSCI World Index – Net Total Return (AUD)
Australian Fixed interest
Bond markets experienced negative total returns during the first quarter of 2026. This performance was largely driven by a significant sell-off in government bonds as yields rose across the curve in response to a more hawkish RBA. Bond yield increases have an inverse relationship with bond prices, leading to capital losses for the index.
After seeing inflation and interest rates ease during 2025, the RBA quickly moved to a tightening monetary policy stance and delivered two consecutive 0.25% interest rate hikes by the RBA in February and March. The RBA’s pivot from its earlier easing stance by higher-than-expected inflation and robust domestic economic data forced a dramatic repricing of bond markets, as investors had entered the year still factoring in potential rate cuts.
Corporate Credit outperformed government bonds in January as credit spreads tightened. However, overall returns remained challenged by rising underlying base rates.
| 3-month return (%) | 1 year (% p.a.) | 10 year (% p.a.) |
|---|---|---|---|
Australian Fixed interest | -0.3 | 1.5 | 1.8 |
Bloomberg AusBond Composite Index
Cash
The benchmark for the Australian cash market rose during the first quarter of 2026 driven by a significant pivot to restrictive monetary policy by the Reserve Bank of Australia (RBA). Persistent and sticky inflation and resilient economic data triggered two consecutive 0.25% rate hikes in February and March bringing the official cash rate to 4.1% at quarter end.
Annual CPI Inflation came in at 3.8% in January and only slightly eased to 3.7% in February, remaining well above the RBA’s 2-3% target range. Significant contributors included housing and electricity (which surged 37% p.a. after the end of government rebates). Other domestic economic data also proved strong, with GDP growing strongly over the December quarter (+0.8%) and over the year (+2.6%). The labour market also continued to remain tight at 4.1%.
Rising oil and gas priced linked to the Middle East conflict between the US/Israel and Iran added new inflationary risks and pushed short term bond yields and bank bills rates higher in March.
| 3-month return (%) | 1 year (% p.a.) | 10 year (% p.a.) |
|---|---|---|---|
| Cash | 0.9 | 3.8 | 2.1 |
Bloomberg AusBond Bank Bill Index
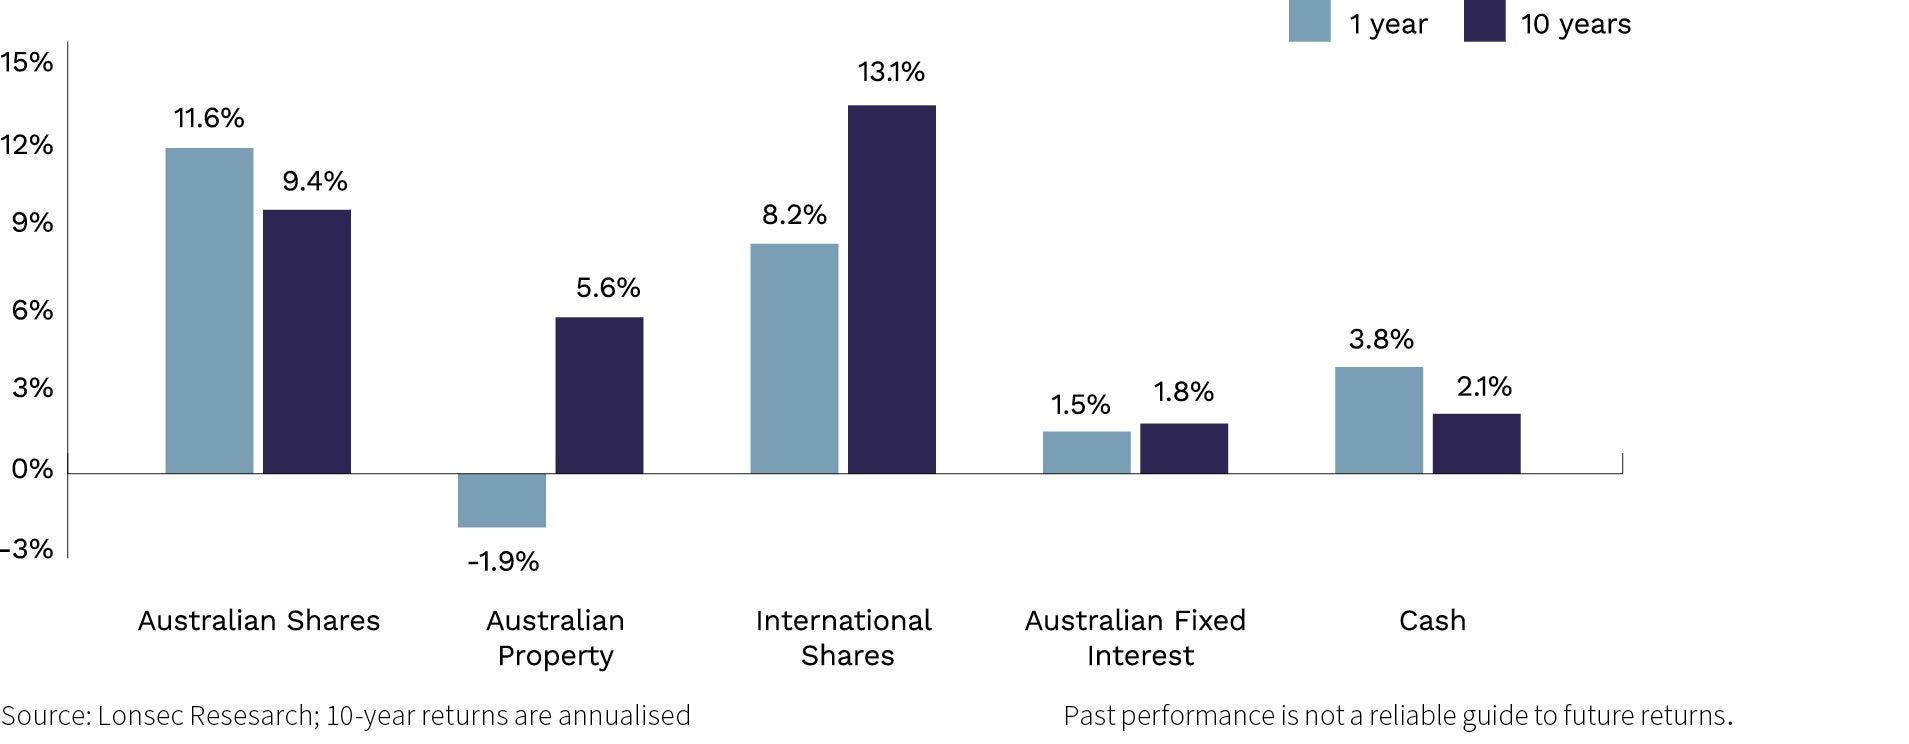
Historical one and ten year returns
The chart below compares one and ten year returns for the major asset classes, as at 31 March 2026.
Seek advice
A qualified financial adviser can help you make sense of your options and ensure your super and investments are structured appropriately. Contact us for a complimentary discussion to see if advice is right for you.